The Influence of Cultural Festival Schedules on Payment Volume Forecasting Models for Local Vendor Networks in Diverse Communities
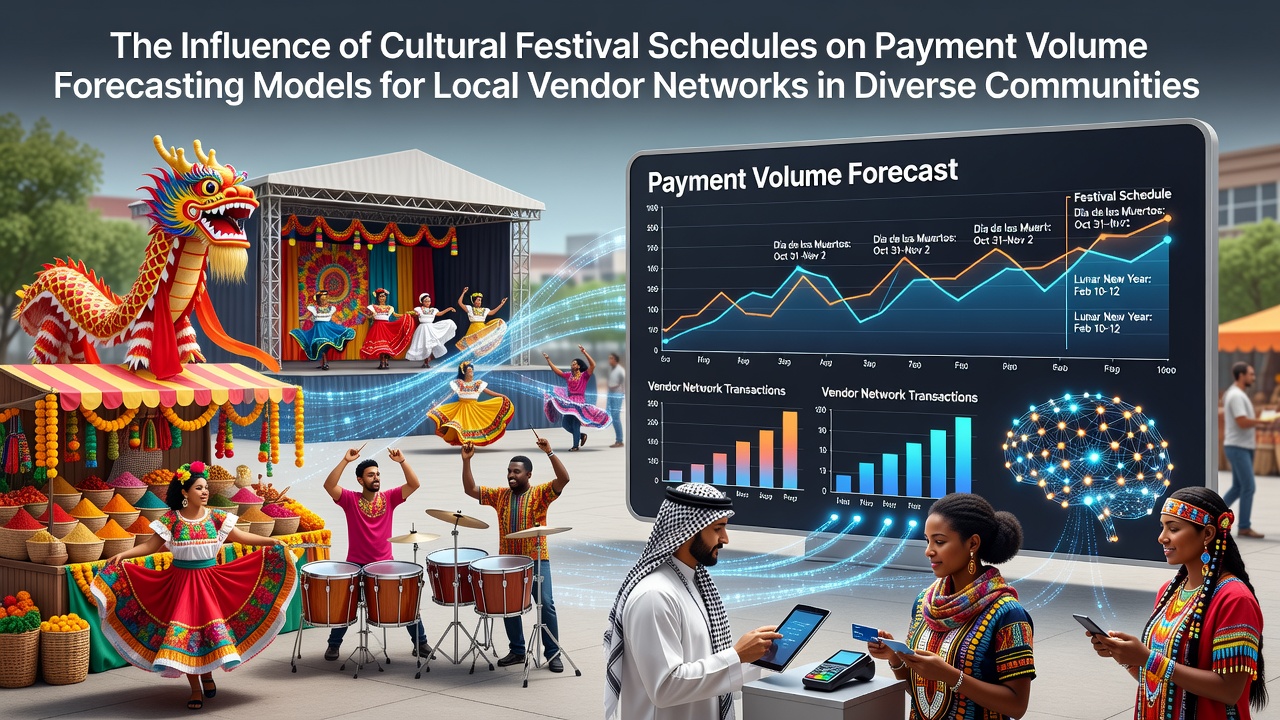
Cultural festival schedules shape payment volume patterns in local vendor networks across diverse communities, and forecasting models incorporate these calendars to adjust predictions for seasonal spikes. Researchers track events such as Diwali, Lunar New Year, Carnival, and Oktoberfest because transaction data reveals consistent surges in card payments, mobile transfers, and cash handling during these periods. Models draw on historical records from payment processors to refine accuracy, while analysts note that communities with overlapping festivals experience compounded effects on vendor cash flow and processor load.
Calendar Data Integration in Forecasting Systems
Payment processors integrate public festival calendars into algorithmic frameworks that weight upcoming dates against baseline volumes. Systems pull dates from municipal records and community organization schedules, then apply multipliers derived from prior years' transaction logs. Data from multiple regions shows that vendors near festival sites record 30 to 150 percent increases in daily volumes depending on event scale, and models adjust coefficients accordingly to avoid underestimating settlement needs. Analysts combine these inputs with weather forecasts and public transit schedules because correlated factors influence attendance and spending behavior.
Forecasting engines also segment vendor types, separating food stalls, artisan booths, and service providers since each category displays distinct response curves. Food vendors often see earlier peaks tied to setup days, whereas retail vendors experience sharper rises on main event dates. This segmentation improves precision when models run Monte Carlo simulations that test various attendance scenarios drawn from past attendance figures published by city tourism offices.
Regional Patterns Across Diverse Communities
Communities with high immigrant populations demonstrate pronounced payment shifts around heritage festivals, and processors in those areas maintain dedicated data streams for events such as Eid, Diwali, and Juneteenth celebrations. In one documented case from a mid-sized Canadian city, vendors near a large South Asian festival reported transaction volumes that doubled on the primary weekend, prompting local banks to increase terminal availability and adjust daily reconciliation windows. Similar patterns appear in Australian markets during Lunar New Year events, where data collected by the Reserve Bank of Australia indicates elevated use of contactless payments among younger attendees.
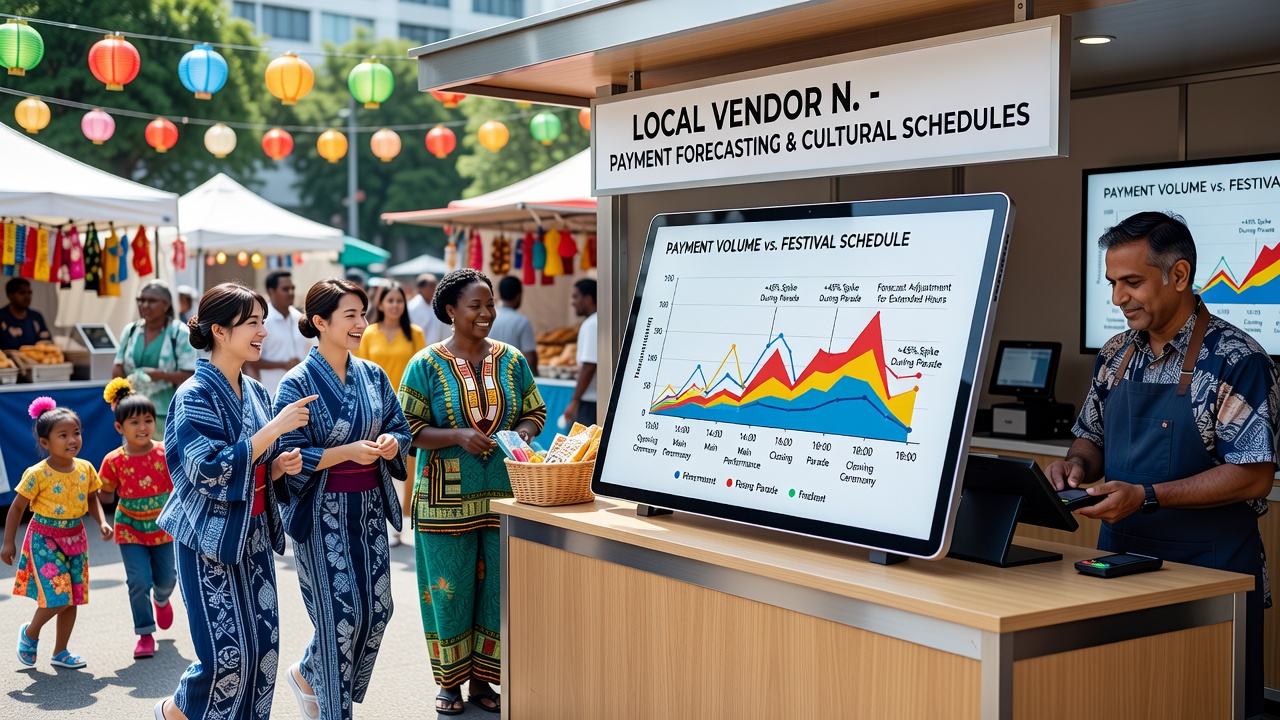
European cities hosting Carnival and Oktoberfest produce comparable datasets, and the European Central Bank publishes aggregated statistics showing elevated card-not-present volumes from advance ticket sales that feed into vendor forecasting. Models trained on these records apply geographic clustering to distinguish between core festival zones and peripheral neighborhoods that experience secondary spillovers. Observers note that vendors operating in overlapping festival calendars must contend with compressed preparation windows, which affects inventory ordering and working capital requirements.
Model Refinement Techniques and Data Sources
Developers refine forecasting models by layering festival-specific variables onto baseline econometric frameworks. Variables include event duration, expected attendance drawn from permit applications, and historical payment velocity measured in transactions per hour. Machine learning layers identify lag effects where elevated volumes persist for several days after main events due to cleanup crews and delayed vendor settlements. Research teams at institutions such as the University of Toronto have published studies examining how these lag patterns vary by festival type and community density.
Validation occurs through backtesting against archived transaction files supplied by processors, and accuracy metrics improve when models receive real-time updates from venue capacity sensors. In September 2026 several North American cities will host concurrent harvest festivals and cultural fairs, giving analysts an opportunity to test updated models against fresh data streams. Processors plan to increase monitoring frequency during that window to capture any deviations from projected curves.
Operational Adjustments for Vendor Networks
Vendor associations coordinate with processors to schedule terminal maintenance and liquidity top-ups ahead of major events. Networks serving diverse communities often maintain shared dashboards that display forecasted volumes alongside actual readings, allowing rapid reallocation of mobile payment units. Studies conducted by the Bank for International Settlements highlight that advance calibration reduces settlement delays and lowers the incidence of declined transactions during peak hours.
Training programs for vendors emphasize recognition of festival-driven demand shifts, and case examples show that operators who align staffing with model outputs experience smoother reconciliation at the close of each event day. Data sharing agreements between municipalities and financial institutions further support these efforts by supplying updated attendance projections that feed directly into forecasting pipelines.
Conclusion
Cultural festival schedules exert measurable influence on payment volume forecasting models used by local vendor networks in diverse communities. Integration of calendar data, segmentation by vendor type, and continuous validation against regional transaction records enable more reliable projections. As additional cities publish attendance and payment statistics, models gain further granularity, supporting efficient operations across overlapping event cycles.